New Paper: Using ERPs and RSA to examine saliency maps and meaning maps for natural scenes

Kiat, J.E., Hayes, T.R., Henderson, J.M., Luck, S.J. (in press). Rapid extraction of the spatial distribution of physical saliency and semantic informativeness from natural scenes in the human brain. The Journal of Neuroscience. https://doi.org/10.1523/JNEUROSCI.0602-21.2021 [preprint]

The influence of physical salience on visual attention in real-world scenes has been extensively studied over the past few decades. Intriguingly, however, recent research has shown that semantically informative scene features often trump physical salience in predicting even the fastest eye movements in natural scene viewing. These results suggest that the brain extracts visual information that is, at the very least, predictive of the spatial distribution of potentially meaningful scene regions very rapidly.

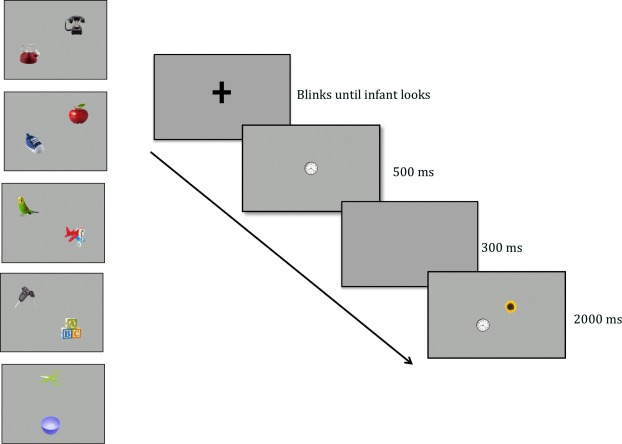
In this new paper, Steve Luck, Taylor Hayes, John Henderson, and I sought to assess the evidence for a neural representation of the spatial distribution of meaningful features and (assuming we found such a link!) contrast the onset of its emergence relative to the onset of physical saliency. To do so, we recorded 64-channel EEG data from subjects viewing a series of real-world scene photographs while performing a modified 1-back task in which subjects were probed on 10% of trials to identify which of four scene quadrants was part of the most recently presented image (see Figure 1).

Figure 1. Stimuli and task. Subjects viewed a sequence of natural scenes. After 10% of scenes, they were probed for their memory of the immediately preceding scene.

With this dataset in hand, we next obtained spatial maps of meaning and saliency for each of the scenes. To measure the spatial distribution of meaningful features, we leveraged the “meaning maps” that had previously been obtained by the Henderson group. These maps are obtained by crowd-sourced human judgments of the meaningfulness of each patch of a given scene. The scene is first decomposed into a series of partially overlapping and tiled circular patches, and subjects rate each circular patch for informativeness (see Figure 2 and Henderson & Hayes, 2017). Then, these ratings are averaged and smoothed to produce a “meaning map,” which reflect the extent to which each location in a scene contains meaningful information. Note that these maps do not indicate the specific meanings, but simply indicate the extent to which any kind of meaningful information is present at each location.

Figure 2. Top: Example scene with corresponding saliency map and meaning map. Two areas are highlighted in blue to make it easier to see how saliency, meaningfulness, and the image correspond in these areas. Bottom: Examples of patches that were used to create the meaning maps. Observers saw individual patches, without any scene context, and rated the meaningfulness of that patch. The ratings across multiple observers for each patch were combined to create the meaning map for a given scene.

The spatial distribution of physical saliency was estimated algorithmically using the Graph-Based Visual Saliency approach (Harel et al., 2006). This algorithm extracts low-level color, orientation, and contrast feature vectors from an image using biologically inspired filters. These features are then used to compute activation maps for each feature type. Finally, these maps are normalized, additively combined, and smoothened to produce an overall “saliency map”. A few examples of meaning and saliency maps for specific scenes are shown in Figure 3. We chose this algorithm in particular because of its combination of biological plausibility and performance at matching human eye movement data.

Figure 3. Examples of images used in the study and the corresponding saliency and meaning maps. The blue regions are intended to make it easier to see correspondences between the maps and the images.

We then used the meaning maps and saliency maps to predict our ERP signals using Representational Similarity Analysis. For an overview of Representational Similarity Analysis in the context of ERPs, check out this video and this blog post.

The results are summarized in Figure 4. Not surprisingly, we found that a link between physical saliency and the ERPs emerged rapidly (ca. 78 ms after stimulus onset). The main question was how long it would take for a link to the meaning maps to be present. Would the spatial distribution of semantic informativeness take hundreds of milliseconds to develop, or would the brain rapidly determine which locations likely contained meaningful information? We found that the link between the meaning maps and the ERPs occurred extremely rapidly, less than 10 ms after the link to the saliency maps (ca. 87 ms after stimulus onset). You can see the timecourse of changes in the strength of the representational link for saliency and meaning in panel A (colored horizontal lines demark FDR corrected p < .05 timepoints) and the jackknifed mean onset latencies for the representational link of saliency and meaning in Panel B (error bars denote standard errors).

Figure 4. Primary results. A) Representational similarity between the ERP data and the saliency and meaning maps at each time point, averaged over participants. Each waveform shows the unique variance explained by each map type. B) Onset latencies from the representational similarity waveforms for saliency and meaning. The onset was only slightly later for the meaning maps than for the saliency maps.

Note that the waveforms show semipartial correlations (i.e., the unique contribution of one type of map when variance due to the other type is factored out). These findings therefore show that meaning maps have a unique neurophysiological basis from saliency.

The rapid time course of the meaning map waveform also indicates that information related to the locations containing potentially meaningful information is computed rapidly, early enough to influence even the earliest eye movements. This is a correlation-based approach, so these results do not indicate that meaning per se is calculated by 87 ms. However, the results indicate that information that predicts the locations of meaningful scene elements is computed by 87 ms. Presumably, this information would be useful for directing shifts of covert and/or overt attention that would in turn allow the actual meanings to be computed.

The data and code are available at https://osf.io/zg7ue/. Please feel free to use this code and dataset (high-density ERP averages for 50 real-world scenes from 32 subjects) to explore research questions that interest you!

New papers on the hyperfocusing hypothesis of cognitive dysfunction in schizophrenia

Luck, S. J., Hahn, B., Leonard, C. J., & Gold, J. M. (2019). The hyperfocusing hypothesis: A new account of cognitive dysfunction in schizophrenia. Schizophrenia Bulletin, 45, 991–1000. https://doi.org/10.1093/schbul/sbz063

Luck, S. J., Leonard, C. J., Hahn, B., & Gold, J. M. (2019). Is selective attention impaired in schizophrenia? Schizophrenia Bulletin, 45, 1001–1011. https://doi.org/10.1093/schbul/sbz045

The most distinctive symptoms of schizophrenia are hallucinations, delusions, and disordered thought/behavior. However, people with schizophrenia also typically have impairments in basic cognitive processes, such as attention and working memory, and the degree of cognitive dysfunction is a better predictor of long-term outcome than is the severity of the psychotic symptoms.

Researchers have tried to identify the nature of cognitive dysfunction in schizophrenia since the 1960s, and our collaborative research group has spent almost 20 years on this problem. We now have a well-supported theory, which we call the hyperfocusing hypothesis, and we recently published a pair of papers that review this theory. The first paper describes the hyperfocusing hypothesis in detail and reviews the evidence for it, and the second paper contrasts it with the traditional idea that schizophrenia involves impaired filtering.

The hyperfocusing hypothesis proposes that schizophrenia involves an abnormally narrow but intense focusing of processing resources. That is, people with schizophrenia are not impaired at focusing their attention; on the contrary, they tend to focus their attention more intensely and more narrowly compared to healthy control subjects. This hypothesis can explain findings from several different cognitive domains, including reductions in working memory capacity (because people with schizophrenia have difficulty dividing resources among multiple memory representations), deficits in experimental paradigms that involve spreading attention broadly (such as the Useful Field of View task), and abnormal capture of attention by irrelevant stimuli that share features with active representations. In addition to explaining many previous findings, the hyperfocusing hypothesis has also led to many new predictions that have been tested and verified. We also find that the degree of hyperfocusing is often correlated with the degree of impairment in measures of broad cognitive function, which are known to be related to long-term outcome.

When a psychiatric group exhibits impaired performance relative to a control group, there are usually many possible explanations (e.g., reduced motivation, impaired task comprehension). However, the hyperfocusing hypothesis proposes that people with schizophrenia focus more strongly than control subjects, which leads to the counterintuitive prediction that people with schizophrenia will exhibit supranormal focusing of processing resources under some conditions. And this is exactly what we have found in several experiments. For example, in both ERP and fMRI studies, we have found that delay-period activity is enhanced in people with schizophrenia relative to control subjects when only a single object is being maintained. This is an example of what we mean by a “more intense” focusing of processing resources. You might be concerned that people with schizophrenia exert greater effort to achieve the same memory performance, and this leads to greater delay-period activity. However, when we examine subgroups that are matched on behavioral measures of working memory capacity, we still find that people with schizophrenia exhibit enhanced activity relative to control subjects when a single item is being remembered.

Classically, schizophrenia has been thought to involve an impairment in selective attention, a “broken filter.” For example, one individual wrote the following in an online forum: “Ever since I started having problems due to schizophrenia, my senses have been thrown out of whack... I remember one day when I got caught in the rain. Each drop felt like an electric shock and I found it hard to move because of how intense and painful the feeling was.” How can we reconcile this evidence for increased distraction with the idea that schizophrenia involves hyperfocusing? The most likely rapprochement between the hyperfocusing hypothesis and the broken filter hypothesis is that schizophrenia also involves impaired executive control, so people with schizophrenia often point their “spotlight” of attention in the wrong direction. As a result, they may focus narrowly and intensely on inputs that would ordinarily be ignored (e.g., drops of rain), producing greater distractibility even though the filtering mechanism itself is operating very intensely.

New ERP Decoding Paper: Reactivation of Previous Experiences in a Working Memory Task

Bae, G.-Y., & Luck, S. J. (in press). Reactivation of Previous Experiences in a Working Memory Task. Psychological Sciencehttps://doi.org/10.1177/0956797619830398

Gi-Yeul Bae and I have previously shown that the ERP scalp distribution can be used to decode which of 16 orientations is currently being stored in visual working memory (VWM). In this new paper, we reanalyze those data and show that we can also decode the orientation of the stimulus from the previous trial. It’s amazing that this much information is present in the pattern of voltage on the surface of the scalp!

Here’s the scientific background: There are many ways in which previously presented information can automatically impact our current cognitive processing and behavior (e.g., semantic priming, perceptual priming, negative priming, proactive interference). An example of this that has received considerable attention recently is the serial dependence effect in visual perception (see, e.g., Fischer & Whitney, 2014). When observers perform a perceptual task on a series of trials, the reported target value on one trial is biased by the target value from the preceding trial. 

We also find this trial-to-trial dependency in visual working memory experiments: The reported orientation on one trial is biased away from the stimulus orientation on the previous trial. On each trial (see figure below), subjects see an oriented teardrop and, after a brief delay, report the remembered orientation by adjusting a new teardrop to match the original teardrop’s orientation. Each trial is independent, and yet the reported orientation on one trial (indicated by the blue circle in the figure) is biased away from the orientation on the previous trial (indicated by the red circle in the figure; note that the circles were not actually colored in the actual experiment). 

N-1-Decoding--Stimuli.jpg

These effects imply that a memory is stored of the previous-trial target, and this memory impacts the processing of the target on the current trial. But what is the nature of this memory?

We considered three possibilities: 1) An active representation from the previous trial is still present on the current trial; 2) The representation from the previous trial is stored in some kind of “activity-silent” synaptic form that influences the flow of information on the current trial; and 3) An activity-silent representation of the previous trial is reactivated when the current trial begins. We found evidence in favor of this third possibility by decoding the previous-trial orientation from the current-trial scalp ERP. That is, we used the ERP scalp distribution at each time point on the current trial to “predict” the orientation on the previous trial.

This previous-trial decoding is shown for two separate experiments in the figure below. Time zero represents the onset of the sample stimulus on the current trial. In both experiments, we could decode the orientation from the previous trial in the period following the onset of the current-trial sample stimulus (gray regions are statistically significant after controlling for multiple comparisons; chance = 1/16). 

N-1-Decoding--Results.jpg

These results indicate that a representation of the previous-trial orientation was activated (and therefore decodable) by the onset of the current-trial stimulus. We can’t prove that this reactivation was actually responsible for the behavioral priming effect, but this at least establishes the plausibility of reactivation as a mechanism of priming (as hypothesized many years ago by Gordon Logan).

This study also demonstrates the power of applying decoding methods to ERP data. These methods allow us to track the information that is currently being represented by the brain, and they have amazing sensitivity to quite subtle effects. Frankly, I was quite surprised when Gi-Yeul first showed me that he could decode the orientation of the previous-trial target. And I wouldn’t have believed it if he hadn’t shown that he replicated the result in an independent set of data.

Gi-Yeul has made the data and code available at https://osf.io/dbgh6/. Please take his code and apply it to your own data!

New paper: N2pc versus TELAS (target-elicited lateralized alpha suppression)

Bacigalupo, F., & Luck, S. J. (in press). Lateralized suppression of alpha-band EEG activity as a mechanism of target processing. The Journal of Neurosciencehttps://doi.org/10.1523/JNEUROSCI.0183-18.2018

Since the classic study of Worden et al. (2000), we have known directing attention to the location of an upcoming target leads to a suppression of alpha-band EEG activity over the contralateral hemisphere. This is usually thought to reflect a preparatory process that increases cortical excitability in the hemisphere that will eventually process the upcoming target (or decreases excitability in the opposite hemisphere). This can be contrasted with the N2pc component, which reflects the focusing of attention onto a currently visible target (reviewed by Luck, 2012). But do these different neural signals actually reflect similar underlying attentional mechanisms? The answer in a new study by Felix Bacigalupo (now on the faculty at Pontificia Universidad Catolica de Chile) appears to be both “yes” (the N2pc component and lateralized alpha suppression can both be triggered by a target, and they are both influenced by some of the same experimental manipulations) and “no” (they have different time courses and are influenced differently by other manipulations).

The study involved two experiments that we were designed to determine whether (a) lateralized alpha suppression would be triggered by a target in a visual search array, and (b) whether this effect could be experimentally dissociated from the N2pc component. The first experiment (shown in the figure below) used a fairly typical N2pc design. Subjects searched for an item of a specific color for a given block of trials. The target color appeared (unpredictably) at one of four locations. Previous research has shown that the N2pc component is primarily present for targets in the lower visual field, and we replicated this result (see ERP waveforms below). We also found that, although alpha-band activity was suppressed over both hemispheres following target presentation, this suppression was greater over the hemisphere contralateral to the target. Remarkably, like the N2pc component, the target-elicited lateralized alpha suppression (TELAS) occurred primarily for targets in the lower visual field. However, the time course of the TELAS was quite different from that of the N2pc. The scalp distribution of the TELAS also appeared to be more posterior than that of the N2pc component (although this was not formally compared).

The second experiment included a crowding manipulation, following up on a previous study in which the N2pc component was found to be largest when flanked by distractors that are at the edge of the crowding range, with a smaller N2pc when the distractors are so close that they prevent perception of the target shape (Bacigalupo & Luck, 2015). We replicated the previous result, but we saw a different pattern with the lateralized alpha suppression: The TELAS effect tended to increase progressively as the flanker distance decreased, with the largest magnitude for the most crowded displays. Thus, the TELAS effect appears to be related to difficulty or effort, whereas the N2pc component appears to be related to whether or not the target is successfully selected.

The bottom line is that visual search targets trigger both an N2pc component and a contralateral suppression of alpha-band EEG oscillations, especially when the targets are in the lower visual field, but the N2pc component and the TELAS effect can also be dissociated, reflecting different mechanisms of attention.

These results are also relevant for the question of whether lateralized alpha effects reflect an increase in alpha in the nontarget hemisphere to suppress information that would otherwise be processed by that hemisphere or, instead, a decrease in alpha in the target hemisphere to enhance the processing of target information. If the TELAS effect reflected processes related to distractors in the hemifield opposite to the target, then we would not expect it to be related to whether the target was in the upper or lower field or whether flankers were near the target item. Thus, the present results are consistent with a role of alpha suppression in increasing the processing of information from the target itself (see also a recent review paper by Josh Foster and Ed Awh).

One interesting side finding: The contralateral positivity that often follows the N2pc component (similar to a Pd component) was clearly present for the upper-field targets. It was difficult to know the amplitude of this component for the lower-field targets given the overlapping N2pc and SPCN components, but the upper-field targets clearly elicited a strong contralateral positivity with little or no N2pc. This provides an interesting dissociation between the post-N2pc contralateral positivity and the N2pc component.

New paper: Using ERPs and alpha oscillations to decode the direction of motion

Bae, G. Y., & Luck, S. J. (2018). Decoding motion direction using the topography of sustained ERPs and alpha oscillations. NeuroImage, 18: 242-255. https://doi.org/10.1016/j.neuroimage.2018.09.029

This is our second paper applying decoding methods to sustained ERPs and alpha-band EEG oscillations. The first one decoded which of 16 orientations was being maintained in working memory. In the new paper, we decoded which of 16 directions of motion was present in random dot kinematograms.

The paradigm is shown in the figure below. During a 1500-ms motion period, 25.6% or 51.2% of the dots moved coherently in one of 16 directions and the remainder moved randomly. After the motion ended, the subject adjusted a green line to match the direction of motion (which they could do quite precisely).

Motion Decoding.jpg

We asked whether we could decode (using machine learning) the precise direction of motion from the scalp distribution of the sustained voltage or alpha-band signal at each moment in time. Decoding the exact direction of motion is very challenging, and chance performance would be only 6.25% correct. During the motion period for the 51.2% coherence level, we were able to decode the direction of motion well above chance on the basis of the sustained ERP voltage (see the bottom right panel of the figure). However, as shown in the bottom left panel, we couldn’t decode the direction of motion on the basis of the alpha-band activity until the report period (during which time attention was presumably focused on the location of the green line).

When the coherence level was only 25.6% (and perception of coherent motion was much more difficult), we could not decode the actual direction of motion above chance. However, we were able to decode the direction of perceived motion (i.e., the direction that the subject reported at the end of the trial).

This study shows that (a) ERPs can be used to decode very subtle stimulus properties, and (b) sustained ERPs and alpha-band oscillations contain different information. In general, alpha-band activity appears to reflect the direction of spatial attention, whereas sustained ERPs contain information about both the direction of attention and the specific feature value being represented.

New paper: What happens to an individual visual working memory representation when it is interrupted?

Bae, G.-Y., & Luck, S. J. (2018). What happens to an individual visual working memory representation when it is interrupted? British Journal of Psychology. https://onlinelibrary.wiley.com/doi/full/10.1111/bjop.12339

Working memory is often conceived as a buffer that holds information currently being operated upon. However, many studies have shown that it is possible to perform fairly complex tasks (e.g., visual search) that are interposed during the retention interval of a change detection task with minimal interference (especially load-dependent interference). One possible explanation is that the information from the change detection task can be held in some other form (e.g., activity-silent memory) while the interposed task is being performed.  If so, this might be expected to have subtle effects on the memory for the stimulus.

To test this, we had subjects perform a delayed estimation task, in which a single teardrop-shaped stimulus was held in memory and was reproduced at the end of the trial (see figure below). A single letter stimulus was presented during the delay period on some trials. We asked whether performing a very simple task with this interposed stimulus would cause a subtle disruption in the memory for the teardrop's orientation.  In some trial blocks, subjects simply ignored the interposed letter, and we found that it produced no disruption of the memory for the teardrop. In other trial blocks, subjects had to make a speeded response to the interposed letter, indicating whether it was a C or a D. Although this was a simple task, and only a single object was being maintained in working memory, the interposed stimulus caused the memory of the teardrop to become less precise and more categorical.

Thus, performing even a simple task on an interposed stimulus can disrupt a previously encoding working memory representation. The representation is not destroyed, but becomes less precise and more categorical, perhaps indicating that it had been offloaded into a different form of storage while the interposed task was being performed. Interestingly, we did not find this effect when an auditory interposed task was used, consistent with modality-specific representations.

Interruption_Paradigm.jpg

VSS Poster: An illusion of opposite-direction motion

At the 2018 VSS meeting, Gi-Yeul Bae will be presenting a poster describing a motion illusion that, as far as we can tell, has never before been reported even though it has been "right under the noses" of many researchers.  As shown in the video below, this illusion arises in the standard "random dot kinematogram" displays that have been used to study motion perception for decades. In the standard task, the motion is either leftward or rightward. However, we allowed the dots to move in any direction in the 360° space, and the task was to report the exact direction at the end of the trial.

In the example video, the coherence level is 25% on some trials and 50% on others (i.e., on average, 25% or 50% of the dots move in one direction, and the other dots move randomly). A line appears at the end of the trial to indicate the direction of motion for that trial.  When you watch a given trial, try to guess the precise direction of motion.  If you are like most people, you will find that you guess a direction that is approximately 180° away from the true direction on a substantial fraction of trials.  You may even see the motion start in one direction and then reverse to the true direction. We recommend that you maximize the video and view it in HD.

In the controlled laboratory experiments described in our poster (which you can download here), we find that 180° errors are much more common than other errors. In addition, our studies suggest that this is a bona fide illusion, in which people confidently perceive a direction of motion that is the opposite of the true direction. If you know of any previous reports of this phenomenon, let us know!

New Paper: Visual short-term memory guides infants’ visual attention

Mitsven, S. G., Cantrell, L. M., Luck, S. J., & Oakes, L. M. (in press). Visual short-term memory guides infants’ visual attention. Cognition. https://doi.org/10.1016/j.cognition.2018.04.016 (Freely available until June 14, 2018 at https://authors.elsevier.com/a/1Wxvg2Hx2bbMQ)

Mitsven.jpg

This new papers shows that visual short-term memory guides attention in infants. Whereas adults orient toward items matching the contents of VSTM, infants orient toward non-matching items.

Review article: How do we avoid being distracted by salient but irrelevant objects in the environment?

Gaspelin, N., & Luck, S. J. (2018). The Role of Inhibition in Avoiding Distraction by Salient Stimuli. Trends in Cognitive Sciences, 22, 79-92.

TICS Suppression.jpg

In this recent TICS paper, Nick Gaspelin and I review the growing evidence that the human brain can actively suppress objects that might otherwise capture our attention.

Decoding the contents of working memory from scalp EEG/ERP signals

Bae, G. Y., & Luck, S. J. (2018). Dissociable Decoding of Working Memory and Spatial Attention from EEG Oscillations and Sustained Potentials. The Journal of Neuroscience, 38, 409-422. [PDF]

In this recent paper, we show that it is possible to decode the exact orientation of a stimulus as it is being held in working memory from sustained (CDA-like) ERPs.  A key finding is that we could decode both the orientation and the location of the attended stimulus with these sustained ERPs, whereas alpha-band EEG signals contained information only about the location.  

Our decoding accuracy is only about 50% above the chance level, but it's still pretty amazing that such precise information can be decoded from brain activity that we're recording from electrodes on the scalp!

Stay tuned for more cool EEG/ERP decoding results — we will be submitting a couple more studies in the near future.