
Why I've lost faith in p values
/[Note: There is a followup to this post.]
There has been a lot written over the past decade (and even longer) about problems associated with null hypothesis statistical testing (NHST) and p values. Personally, I have found most of these arguments unconvincing. However, one of the problems with p values has been gnawing at me for the past couple years, and it has finally gotten to the point that I'm thinking about abandoning p values. Note: this has nothing to do with p-hacking (which is a huge but separate issue).
Here's the problem in a nutshell: If you run 1000 experiments over the course of your career, and you get a significant effect (p < .05) in 95 of those experiments, you might expect that 5% of these 95 significant effects would be false positives. However, as an example shown later in this blog will show, the actual false positive rate may be 47%, even if you're not doing anything wrong (p-hacking, etc.). In other words, nearly half of your significant effects may be false positives, leading you to draw completely bogus conclusions that you are able to publish. On the other hand, your false positive rate might instead be 3%. Or 20%. And my false positive rate might be very different from your false positive rate, even though we are both using p < .05 as our criterion for significance (even if neither of us is engaged in p-hacking, etc.). In other words, p values do not actually tell you anything meaningful about the false positive rate.
But isn't this exactly what p values are supposed to tell us? Don't they tell us the false positive rate? Not if you define "false positive rate" in a way that is actually useful. Here's why:
The false positive rate (Type I error rate) as defined by NHST is the probability that you will falsely reject the null hypothesis when the null hypothesis is true. In other words, if you reject the null hypothesis when p < .05, this guarantees that you will get a significant (but bogus) effect in only 5% of experiments in which the null hypothesis is true. However, this is a statement about what happens when the null hypothesis is actually true. In real research, we don't know whether the null hypothesis is actually true. If we knew that, we wouldn't need any statistics! In real research, we have a p value, and we want to know whether we should accept or reject the null hypothesis. The probability of a false positive in that situation is not the same as the probability of a false positive when the null hypothesis is true. It can be way higher.
For example, imagine that I am a journal editor, and I accept papers when the studies are well designed, well executed, and statistically significant (p < .05 without any p-hacking). I would like to believe that no more than 5% of these effects are actually Type I errors (false positives). In other words: I want to know the probability that the null is true given that an observed effect is significant. We can call this probability "p(null | significant effect)". However, what NHST actually tells me is the probability that I will get a significant effect if the null is true. We can call this probability "p(significant effect | null)". These two probabilities seem pretty similar, because they have the exactly the same terms (but in opposite orders). Despite the superficial similarity, in practice they can be vastly different.
The rest of this blog provides concrete examples of how these two probabilities can be very different and how the probability of a false positive can be much higher than 5%. These examples involve a little bit of math (just multiplication and division — no algebra and certainly no calculus). But you can't avoid a little bit of math if you want to understand what p values can and cannot tell you. If you've never gone through one of these examples before, it's well worth the small amount of effort needed. It will change your understanding of p values.
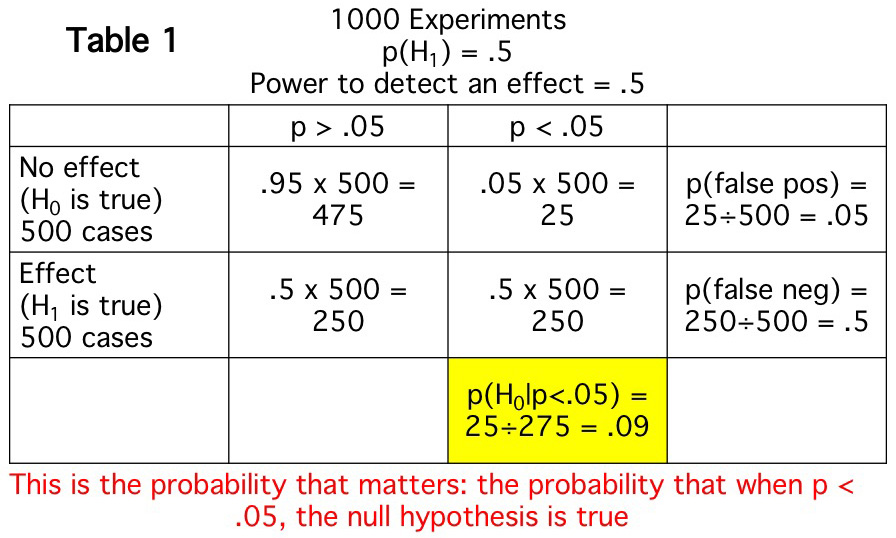
The first example simulates a simple situation in which—because it is a simulation—I can make assumptions that I couldn't make in actual research. These assumptions let us see exactly what would happen under a set of simple, known conditions. The simulation, which is summarized in Table 1, shows what I would expect to find if I ran 1000 experiments in which two things are assumed to be true: 1) the null and alternative hypotheses are equally likely to be true (i.e., the probability that there really is an effect is .5); 2) when an effect is present, there is a 50% chance that it will be statistically significant (i.e., my power to detect an effect is .5). These two assumptions are somewhat arbitrary, but they are a reasonable approximation of a lot of studies.
Table 1 shows what I would expect to find in this situation. The null will be true in 500 of my 1000 experiments (as a result of assumption 1). In those 500 experiments, I would expect a significant effect 5% of the time (assuming that my alpha is .05). This is because my Type I error rate is 5% (assuming an alpha of .05). This Type I error rate is what I previously called p(significant effect | null), because it's the probability that I will get a significant effect when the null hypothesis is actually true. In the other 500 experiments, the alternative hypothesis is true. Because my power to detect an effect is .5 (as a result of assumption 2), I get a significant effect in half of these 500 experiments. Unless you are running a lot of subjects in your experiments, this is a pretty typical level of statistical power.
However, the Type I error rate of 5% does not help me determine the likelihood that I am falsely rejecting the null hypothesis when I get a significant effect, p(null | significant effect). This probability is shown in the yellow box. In other words, in real research, I don't actually know when the null is actually true or false; all I know is whether the p value is < .05. This example shows that—if the null is true in half of my experiments and my power is .05—I would expect to get 275 significant effects (i.e., 275 experiments in which p < .05), and I would expect that the null is actually true in 25 of these 275 experiments. In other words, the probability that one of my significant effects is actually bogus (a false positive) is 9%, not 5%.

This might not seem so bad. I'm still drawing the right conclusion over 90% of the time when I get a significant effect (assuming that I've done everything appropriately in running and analyzing my experiments). However, there are many cases where I am testing bold, risky hypotheses—that is, hypotheses that are unlikely to be true. As Table 2 shows, if there is a true effect in only 10% of the experiments I run, almost half of my significant effects will be bogus (i.e., p(null | significant effect) = .47).
The probability of a bogus effect is also high if I run an experiment with low power. For example, if the null and alternative are equally likely to be true (as in Table 1), but my power to detect an effect (when an effect is present) is only .1, fully 1/3 of my significant effects would be expected to be bogus (i.e., p(null | significant effect) = .33).
Of course, the research from most labs (and the papers submitted to most journals) consist of a mixture of high-risk and low-risk studies and a mixture of different levels of statistical power. But without knowing the probability of the null and the statistical power, I can't know what proportion of the significant results are likely to be bogus. This is why, as I stated earlier, p values do not actually tell you anything meaningful about the false positive rate. In a real experiment, you do not know when the null is true and when it is false, and a p value only tells you about what will happen when the null is true. It does not tell you the probability that a significant effect is bogus. This is why I've lost my faith in p values. They just don't tell me anything.
Yesterday, one of my postdocs showed me a small but statistically significant effect that seemed unlikely to be true. That is, if he had asked me how likely this effect was before I saw the result, I would have said something like 20%. And the power to detect this effect, if real, was pretty small, maybe .25. So I told him that I didn't believe the result, even though it was significant, because p(null | significant effect) is high when an effect is unlikely and when power is low. He agreed.
Tables 1 and 2 make me wonder why anyone ever thought that we should use p values as a heuristic to avoid publishing a lot of effects that are actually bogus. The whole point of NHST is supposedly to maintain a low probability of false positives. However, this would require knowing p(null | significant effect), which is something we can never know in real research. We can see what would be expected by conducting simulations (like those in Tables 1 and 2). However, we do not know the probability that the null hypothesis is true (assumption 1) and we do not know the statistical power (assumption 2), and we would need to know these to be able to calculate p(null | significant effect). So why did statisticians tell us that we should use this approach? And why did we believe them? [Moreover, why did they not insist that we do a correction for multiple comparison when we do a factorial ANOVA that produces multiple p values? See this post on the Virtual ERP Boot Camp blog and this related paper from the Wagenmakers lab.]
Here's an even more pressing, practical question: What should we do given that p values can't tell us what we actually need to know? I've spent the last year exploring Bayes factors as an alternative. I've had a really interesting interchange with advocates of Bayesian approaches about this on Facebook (see the series of posts beginning on April 7, 2018). This interchange has convinced me that Bayes factors are potentially useful. However, they don't really solve the problem of wanting to know the probability that an effect is actually null. This isn't what Bayes factors are for: this would be using a Bayesian statistic to ask a frequentist question.
Another solution is to make sure that statistical power is high by testing larger sample sizes. I'm definitely in favor of greater power, and the typical N in my lab is about twice as high now as it was 15 years ago. But this doesn't solve the problem, because the false positive rate is still high when you are testing bold, novel hypotheses. The fundamental problem is that p values don't mean what we "need" them to mean, that is p(null | significant effect).
Many researchers are now arguing that we should, more generally, move away from using statistics to make all-or-none decisions and instead use them for "estimation". In other words, instead of asking whether an effect is null or not, we should ask how big the effect is likely to be given the data. However, at the end of the day, editors need to make an all-or-none decision about whether to publish a paper, and if we do not have an agreed-upon standard of evidence, it would be very easy for people's theoretical biases to impact decisions about whether a paper should be published (even more than they already do). But I'm starting to warm up to the idea that we should focus more on estimation than on all-or-none decisions about the null hypothesis.
I've come to the conclusion that best solution, at least in my areas of research, is what I was told many times by my graduate advisor, Steve Hillyard: "Replication is the best statistic." Some have argued that replication can also be problematic. However, most of these potential problems are relatively minor in my areas of research. And the major research findings in these areas have held up pretty well over time, even in registered replications.
I would like to end by noting that lots of people have discussed this issue before, and there are some great papers talking about this problem. The most famous is Ionnidis (2005, PLoS Medicine). A neuroscience-specific example is Button et al. (2015, Nature Reviews Neuroscience) (but see Nord et al., 2017, Journal of Neuroscience for an important re-analysis). However, I often find that these papers are bombastic and/or hard to understand. I hope that this post helps more people understand why p values are so problematic.
For more, see this follow-up post.