New Book: Applied ERP Data Analysis

I’m excited to announce my new book, Applied ERP Data Analysis. It’s available online FOR FREE on the LibreTexts open source textbook platform. You can cite it as: Luck, S. J. (2022). Applied Event-Related Potential Data Analysis. LibreTexts. https://doi.org/10.18115/D5QG92

The book is designed to be read online, but LibreTexts has a tool for creating a PDF. You can then print the PDF if you prefer to read on paper.

I’ve aimed the book at beginning and intermediate ERP researchers. I assume that you already know the basic concepts behind ERPs, which you can learn from my free online Intro to ERPs course (which takes 3-4 hours to complete).

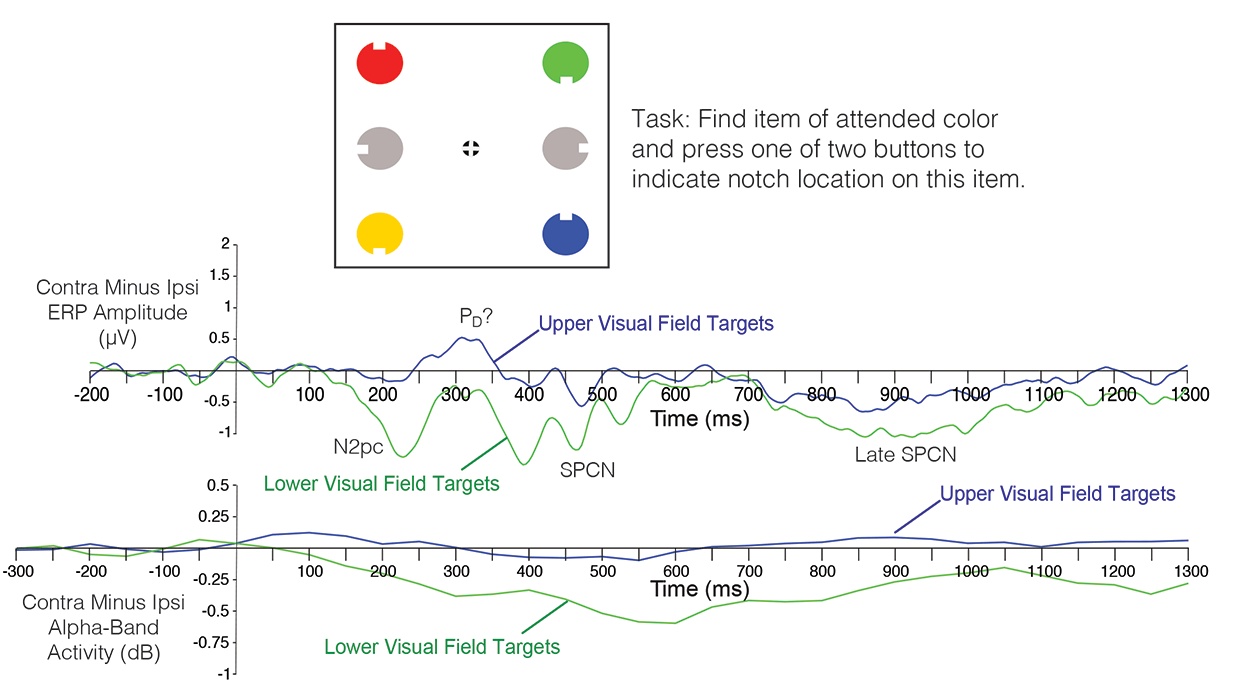
Whereas my previous book focuses on conceptual issues, the new book focuses on how to implement these concepts with real data. Most of the book consists of exercises in which you process data from the ERP CORE, a set of six ERP paradigms that yield seven different components (P3b, N400, MMN, N2pc, N170, ERN, LRP). Learn by doing!

With real data, you must deal with all kinds of weird problems and make many decisions. The book will teach you principled approaches to solving these problems and making optimal decisions.

Side note: my approach in this book was inspired by Mike X Cohen’s excellent book, Analyzing Neural Time Series Data: Theory and Practice.

You will analyze the data using EEGLAB and ERPLAB, which are free open source Matlab toolboxes. Make sure to download version 9 of ERPLAB. (You may need to buy Matlab, but many institutions provide free or discounted licenses for students.) Although you will learn a lot about these specific software packages, the exercises and accompanying text are designed to teach broader concepts that will translate to any software package (and any ERP paradigm). The logic is much more important than the software!

One key element of the approach, however, is currently ERPLAB-specific. Specifically, the book frequently asks whether a given choice increases or decreases the data quality of the averaged ERPs, as quantified with the Standardized Measurement Error (SME). If this approach makes sense to you, but you prefer a different analysis package, you should encourage the developers of that package to implement SME. All our code is open source, so translating it to a different package should be straightforward. If enough people ask, they will listen!

The book also contains a chapter on scripting, plus tons of example scripts. You don’t have to write scripts for the other chapters. But learning some simple scripting will make you more productive and increase the quality, innovation, and reproducibility of your research.

I made the book free and open source so that I could give something back to the ERP community, which has given me so much over the years. But I’ve discovered two downsides to making the book free. First, there was no copy editor, so there are probably tons of typos and other errors. Please shoot me an email if you find an error. (But I can’t realistically provide tech support if you have trouble with the software.) Second, there is no marketing budget, so please spread the word to friends, colleagues, students, and billionaire philanthropists.

This book was also designed for use in undergrad and grad courses. The LibreTexts platform makes it easy for you to create a customized version of the book. You can reorder or delete sections or whole chapters. And you can add new sections or edit any of the existing text. It’s published with a CC-BY license, so you can do anything you want with it as long as you provide an attribution to the original source. And if you don’t like some of the recommendations I make in the book, you can just change it to say whatever you like! For example, you can add a chapter titled “Why Steve Luck is wrong about filtering.”

If you are a PI: the combination of the online course, this book, and the resources provided by PURSUE give you a great way to get new students started in the lab. I’m hoping this makes it easier for faculty to get more undergrads involved in ERP research. 

New Paper: Using ERPs and RSA to examine saliency maps and meaning maps for natural scenes

Kiat, J.E., Hayes, T.R., Henderson, J.M., Luck, S.J. (in press). Rapid extraction of the spatial distribution of physical saliency and semantic informativeness from natural scenes in the human brain. The Journal of Neuroscience. https://doi.org/10.1523/JNEUROSCI.0602-21.2021 [preprint]

The influence of physical salience on visual attention in real-world scenes has been extensively studied over the past few decades. Intriguingly, however, recent research has shown that semantically informative scene features often trump physical salience in predicting even the fastest eye movements in natural scene viewing. These results suggest that the brain extracts visual information that is, at the very least, predictive of the spatial distribution of potentially meaningful scene regions very rapidly.

In this new paper, Steve Luck, Taylor Hayes, John Henderson, and I sought to assess the evidence for a neural representation of the spatial distribution of meaningful features and (assuming we found such a link!) contrast the onset of its emergence relative to the onset of physical saliency. To do so, we recorded 64-channel EEG data from subjects viewing a series of real-world scene photographs while performing a modified 1-back task in which subjects were probed on 10% of trials to identify which of four scene quadrants was part of the most recently presented image (see Figure 1).

Figure 1. Stimuli and task. Subjects viewed a sequence of natural scenes. After 10% of scenes, they were probed for their memory of the immediately preceding scene.

With this dataset in hand, we next obtained spatial maps of meaning and saliency for each of the scenes. To measure the spatial distribution of meaningful features, we leveraged the “meaning maps” that had previously been obtained by the Henderson group. These maps are obtained by crowd-sourced human judgments of the meaningfulness of each patch of a given scene. The scene is first decomposed into a series of partially overlapping and tiled circular patches, and subjects rate each circular patch for informativeness (see Figure 2 and Henderson & Hayes, 2017). Then, these ratings are averaged and smoothed to produce a “meaning map,” which reflect the extent to which each location in a scene contains meaningful information. Note that these maps do not indicate the specific meanings, but simply indicate the extent to which any kind of meaningful information is present at each location.

Figure 2. Top: Example scene with corresponding saliency map and meaning map. Two areas are highlighted in blue to make it easier to see how saliency, meaningfulness, and the image correspond in these areas. Bottom: Examples of patches that were used to create the meaning maps. Observers saw individual patches, without any scene context, and rated the meaningfulness of that patch. The ratings across multiple observers for each patch were combined to create the meaning map for a given scene.

The spatial distribution of physical saliency was estimated algorithmically using the Graph-Based Visual Saliency approach (Harel et al., 2006). This algorithm extracts low-level color, orientation, and contrast feature vectors from an image using biologically inspired filters. These features are then used to compute activation maps for each feature type. Finally, these maps are normalized, additively combined, and smoothened to produce an overall “saliency map”. A few examples of meaning and saliency maps for specific scenes are shown in Figure 3. We chose this algorithm in particular because of its combination of biological plausibility and performance at matching human eye movement data.

Figure 3. Examples of images used in the study and the corresponding saliency and meaning maps. The blue regions are intended to make it easier to see correspondences between the maps and the images.

We then used the meaning maps and saliency maps to predict our ERP signals using Representational Similarity Analysis. For an overview of Representational Similarity Analysis in the context of ERPs, check out this video and this blog post.

The results are summarized in Figure 4. Not surprisingly, we found that a link between physical saliency and the ERPs emerged rapidly (ca. 78 ms after stimulus onset). The main question was how long it would take for a link to the meaning maps to be present. Would the spatial distribution of semantic informativeness take hundreds of milliseconds to develop, or would the brain rapidly determine which locations likely contained meaningful information? We found that the link between the meaning maps and the ERPs occurred extremely rapidly, less than 10 ms after the link to the saliency maps (ca. 87 ms after stimulus onset). You can see the timecourse of changes in the strength of the representational link for saliency and meaning in panel A (colored horizontal lines demark FDR corrected p < .05 timepoints) and the jackknifed mean onset latencies for the representational link of saliency and meaning in Panel B (error bars denote standard errors).

Figure 4. Primary results. A) Representational similarity between the ERP data and the saliency and meaning maps at each time point, averaged over participants. Each waveform shows the unique variance explained by each map type. B) Onset latencies from the representational similarity waveforms for saliency and meaning. The onset was only slightly later for the meaning maps than for the saliency maps.

Note that the waveforms show semipartial correlations (i.e., the unique contribution of one type of map when variance due to the other type is factored out). These findings therefore show that meaning maps have a unique neurophysiological basis from saliency.

The rapid time course of the meaning map waveform also indicates that information related to the locations containing potentially meaningful information is computed rapidly, early enough to influence even the earliest eye movements. This is a correlation-based approach, so these results do not indicate that meaning per se is calculated by 87 ms. However, the results indicate that information that predicts the locations of meaningful scene elements is computed by 87 ms. Presumably, this information would be useful for directing shifts of covert and/or overt attention that would in turn allow the actual meanings to be computed.

The data and code are available at https://osf.io/zg7ue/. Please feel free to use this code and dataset (high-density ERP averages for 50 real-world scenes from 32 subjects) to explore research questions that interest you!

Postdoc position available in the Luck lab

A postdoc position focused on ERP methods development and ERPLAB Toolbox is available in the laboratory of Steve Luck at the UC-Davis Center for Mind & Brain. Both U.S. and international applicants are welcome. Multiple years of funding are possible. Our lab places significant emphasis on postdoctoral training, and we have an excellent track record of placing our postdocs in faculty and industry positions. The position is available immediately, but we are prepared to wait up to 6 months for the right applicant.

Our lab is deeply involved in using, developing, and promoting EEG/ERP methods. In addition to using ERPs in both basic science and clinical research, our lab produces ERPLAB Toolbox, a Matlab-based ERP data analysis package that plugs into the EEGLAB package. ERPLAB has been downloaded >50,000 times and has been used in >2000 published papers. Our lab also runs the ERP Boot Camp, a yearly summer workshop on ERP methods, and we have conducted several large online webinars focused on multivariate pattern analysis and other advanced methods. We have also recently released a large dataset, the ERP CORE, and a new metric of data quality for averaged ERPs called the Standardized Measurement Error. We are also currently developing multivariate pattern analysis methods for EEG/ERP data. Our overall goal is to promote best practices in ERP research so that this method can have the maximum impact in research on the mind and brain.

We are seeking someone to take over the major programming responsibilities for ERPLAB Toolbox and to contribute to the conceptualization and design of the package as it continues to evolve. Plans for the next several years include a new graphical user interface, the addition of multivariate pattern analysis routines, and the addition of an EEG simulation module. We also plan to improve and expand our new metric of data quality and our methods for multivariate pattern analysis of EEG/ERP data. There will also be opportunities for involvement in the various EEG/ERP research and training activities in our laboratory, including our basic science research on visual cognition and our clinical research on schizophrenia. This is a great position for someone with interests in developing/implementing new methods and improving the quality of ERP research broadly for the field.

Required qualifications include a PhD in Psychology, Neuroscience, or related field; excellent English language communication skills; substantial research experience with ERPs; and extensive Matlab programming experience. Preferred qualifications include extensive experience with EEGLAB and/or ERPLAB. Salary will depend on experience, with a minimum set by the University of California postdoc salary scale (which is higher than NIH scale). We will begin accepting applications immediately, and the position will close once a suitable candidate is identified, so it is recommended that you apply soon. We are aiming for a start date between July 15, 2021 and January 1, 2022.

Davis is a vibrant college town in Northern California, located approximately 20 minutes from Sacramento, 75 minutes from San Francisco, 45 minutes from Napa, and 2 hours from Lake Tahoe.  The Center for Mind & Brain is an interdisciplinary and collaborative research center devoted to cognitive science and cognitive neuroscience, located in a beautiful building with state-of-the-art laboratories.

To apply, send a cover letter describing your background and interests, a CV, and at least one letter of recommendation to Aaron Simmons (lucklab.manager@gmail.com). UC Davis is a diverse community that welcomes individuals from underrepresented and disadvantaged groups, and all applicants are encouraged (but not required) to include a statement of contributions to diversity with their materials.


New ERP Decoding Paper: Reactivation of Previous Experiences in a Working Memory Task

Bae, G.-Y., & Luck, S. J. (in press). Reactivation of Previous Experiences in a Working Memory Task. Psychological Sciencehttps://doi.org/10.1177/0956797619830398

Gi-Yeul Bae and I have previously shown that the ERP scalp distribution can be used to decode which of 16 orientations is currently being stored in visual working memory (VWM). In this new paper, we reanalyze those data and show that we can also decode the orientation of the stimulus from the previous trial. It’s amazing that this much information is present in the pattern of voltage on the surface of the scalp!

Here’s the scientific background: There are many ways in which previously presented information can automatically impact our current cognitive processing and behavior (e.g., semantic priming, perceptual priming, negative priming, proactive interference). An example of this that has received considerable attention recently is the serial dependence effect in visual perception (see, e.g., Fischer & Whitney, 2014). When observers perform a perceptual task on a series of trials, the reported target value on one trial is biased by the target value from the preceding trial. 

We also find this trial-to-trial dependency in visual working memory experiments: The reported orientation on one trial is biased away from the stimulus orientation on the previous trial. On each trial (see figure below), subjects see an oriented teardrop and, after a brief delay, report the remembered orientation by adjusting a new teardrop to match the original teardrop’s orientation. Each trial is independent, and yet the reported orientation on one trial (indicated by the blue circle in the figure) is biased away from the orientation on the previous trial (indicated by the red circle in the figure; note that the circles were not actually colored in the actual experiment). 

N-1-Decoding--Stimuli.jpg

These effects imply that a memory is stored of the previous-trial target, and this memory impacts the processing of the target on the current trial. But what is the nature of this memory?

We considered three possibilities: 1) An active representation from the previous trial is still present on the current trial; 2) The representation from the previous trial is stored in some kind of “activity-silent” synaptic form that influences the flow of information on the current trial; and 3) An activity-silent representation of the previous trial is reactivated when the current trial begins. We found evidence in favor of this third possibility by decoding the previous-trial orientation from the current-trial scalp ERP. That is, we used the ERP scalp distribution at each time point on the current trial to “predict” the orientation on the previous trial.

This previous-trial decoding is shown for two separate experiments in the figure below. Time zero represents the onset of the sample stimulus on the current trial. In both experiments, we could decode the orientation from the previous trial in the period following the onset of the current-trial sample stimulus (gray regions are statistically significant after controlling for multiple comparisons; chance = 1/16). 

N-1-Decoding--Results.jpg

These results indicate that a representation of the previous-trial orientation was activated (and therefore decodable) by the onset of the current-trial stimulus. We can’t prove that this reactivation was actually responsible for the behavioral priming effect, but this at least establishes the plausibility of reactivation as a mechanism of priming (as hypothesized many years ago by Gordon Logan).

This study also demonstrates the power of applying decoding methods to ERP data. These methods allow us to track the information that is currently being represented by the brain, and they have amazing sensitivity to quite subtle effects. Frankly, I was quite surprised when Gi-Yeul first showed me that he could decode the orientation of the previous-trial target. And I wouldn’t have believed it if he hadn’t shown that he replicated the result in an independent set of data.

Gi-Yeul has made the data and code available at https://osf.io/dbgh6/. Please take his code and apply it to your own data!

New paper: N2pc versus TELAS (target-elicited lateralized alpha suppression)

Bacigalupo, F., & Luck, S. J. (in press). Lateralized suppression of alpha-band EEG activity as a mechanism of target processing. The Journal of Neurosciencehttps://doi.org/10.1523/JNEUROSCI.0183-18.2018

Since the classic study of Worden et al. (2000), we have known directing attention to the location of an upcoming target leads to a suppression of alpha-band EEG activity over the contralateral hemisphere. This is usually thought to reflect a preparatory process that increases cortical excitability in the hemisphere that will eventually process the upcoming target (or decreases excitability in the opposite hemisphere). This can be contrasted with the N2pc component, which reflects the focusing of attention onto a currently visible target (reviewed by Luck, 2012). But do these different neural signals actually reflect similar underlying attentional mechanisms? The answer in a new study by Felix Bacigalupo (now on the faculty at Pontificia Universidad Catolica de Chile) appears to be both “yes” (the N2pc component and lateralized alpha suppression can both be triggered by a target, and they are both influenced by some of the same experimental manipulations) and “no” (they have different time courses and are influenced differently by other manipulations).

The study involved two experiments that we were designed to determine whether (a) lateralized alpha suppression would be triggered by a target in a visual search array, and (b) whether this effect could be experimentally dissociated from the N2pc component. The first experiment (shown in the figure below) used a fairly typical N2pc design. Subjects searched for an item of a specific color for a given block of trials. The target color appeared (unpredictably) at one of four locations. Previous research has shown that the N2pc component is primarily present for targets in the lower visual field, and we replicated this result (see ERP waveforms below). We also found that, although alpha-band activity was suppressed over both hemispheres following target presentation, this suppression was greater over the hemisphere contralateral to the target. Remarkably, like the N2pc component, the target-elicited lateralized alpha suppression (TELAS) occurred primarily for targets in the lower visual field. However, the time course of the TELAS was quite different from that of the N2pc. The scalp distribution of the TELAS also appeared to be more posterior than that of the N2pc component (although this was not formally compared).

The second experiment included a crowding manipulation, following up on a previous study in which the N2pc component was found to be largest when flanked by distractors that are at the edge of the crowding range, with a smaller N2pc when the distractors are so close that they prevent perception of the target shape (Bacigalupo & Luck, 2015). We replicated the previous result, but we saw a different pattern with the lateralized alpha suppression: The TELAS effect tended to increase progressively as the flanker distance decreased, with the largest magnitude for the most crowded displays. Thus, the TELAS effect appears to be related to difficulty or effort, whereas the N2pc component appears to be related to whether or not the target is successfully selected.

The bottom line is that visual search targets trigger both an N2pc component and a contralateral suppression of alpha-band EEG oscillations, especially when the targets are in the lower visual field, but the N2pc component and the TELAS effect can also be dissociated, reflecting different mechanisms of attention.

These results are also relevant for the question of whether lateralized alpha effects reflect an increase in alpha in the nontarget hemisphere to suppress information that would otherwise be processed by that hemisphere or, instead, a decrease in alpha in the target hemisphere to enhance the processing of target information. If the TELAS effect reflected processes related to distractors in the hemifield opposite to the target, then we would not expect it to be related to whether the target was in the upper or lower field or whether flankers were near the target item. Thus, the present results are consistent with a role of alpha suppression in increasing the processing of information from the target itself (see also a recent review paper by Josh Foster and Ed Awh).

One interesting side finding: The contralateral positivity that often follows the N2pc component (similar to a Pd component) was clearly present for the upper-field targets. It was difficult to know the amplitude of this component for the lower-field targets given the overlapping N2pc and SPCN components, but the upper-field targets clearly elicited a strong contralateral positivity with little or no N2pc. This provides an interesting dissociation between the post-N2pc contralateral positivity and the N2pc component.

New paper: Using ERPs and alpha oscillations to decode the direction of motion

Bae, G. Y., & Luck, S. J. (2018). Decoding motion direction using the topography of sustained ERPs and alpha oscillations. NeuroImage, 18: 242-255. https://doi.org/10.1016/j.neuroimage.2018.09.029

This is our second paper applying decoding methods to sustained ERPs and alpha-band EEG oscillations. The first one decoded which of 16 orientations was being maintained in working memory. In the new paper, we decoded which of 16 directions of motion was present in random dot kinematograms.

The paradigm is shown in the figure below. During a 1500-ms motion period, 25.6% or 51.2% of the dots moved coherently in one of 16 directions and the remainder moved randomly. After the motion ended, the subject adjusted a green line to match the direction of motion (which they could do quite precisely).

Motion Decoding.jpg

We asked whether we could decode (using machine learning) the precise direction of motion from the scalp distribution of the sustained voltage or alpha-band signal at each moment in time. Decoding the exact direction of motion is very challenging, and chance performance would be only 6.25% correct. During the motion period for the 51.2% coherence level, we were able to decode the direction of motion well above chance on the basis of the sustained ERP voltage (see the bottom right panel of the figure). However, as shown in the bottom left panel, we couldn’t decode the direction of motion on the basis of the alpha-band activity until the report period (during which time attention was presumably focused on the location of the green line).

When the coherence level was only 25.6% (and perception of coherent motion was much more difficult), we could not decode the actual direction of motion above chance. However, we were able to decode the direction of perceived motion (i.e., the direction that the subject reported at the end of the trial).

This study shows that (a) ERPs can be used to decode very subtle stimulus properties, and (b) sustained ERPs and alpha-band oscillations contain different information. In general, alpha-band activity appears to reflect the direction of spatial attention, whereas sustained ERPs contain information about both the direction of attention and the specific feature value being represented.

How to p-hack (and avoid p-hacking) in ERP research

Luck, S. J., & Gaspelin, N. (2017). How to Get Statistically Significant Effects in Any ERP Experiment (and Why You Shouldn’t)Psychophysiology, 54, 146-157.

How to get a significant effect.jpg

In this article, we show how ridiculously easy it is to find significant effects in ERP experiments by using the observed data to guide the selection of time windows and electrode sites. We also show that including multiple factors in your ANOVAs can dramatically increase the rate of false positives (Type I errors). We provide some suggestions for methods to avoid inflating the Type I error rate.

This paper was part of a special issue of Psychophysiology on Reproducibility edited by Emily Kappenman and Andreas Keil.

New Paper: Combined Electrophysiological and Behavioral Evidence for the Suppression of Salient Distractors

Gaspelin, N., & Luck, S. J. (in press). Combined Electrophysiological and Behavioral Evidence for the Suppression of Salient Distractors. Journal of Cognitive Neuroscience.

Gaspelin-Pd.jpg

Evidence that people can suppress salient-but-irrelevant color singletons has come from ERP studies and from behavioral studies.  The ERP studies find that, under appropriate conditions, singleton distractors will elicit a Pd component, a putative electrophysiological signature of suppression (discovered by Hickey, Di Lollo, and McDonald, 2009). The behavioral studies show that processing at the location of the singleton is suppressed below the level of nonsingleton distractors (reviewed by Gaspelin & Luck, 2018).  Are these electrophysiological and behavioral signatures of suppression actually related?

In the present study, Nick Gaspelin and I used an experimental paradigm in which it was possible to assess both the ERP and behavioral measures of suppression.  First, we were able to demonstrate that suppression of the salient singleton distractors was present according to both measures.  Second, we found that these two measures were correlated: participants who should a larger Pd also showed greater behavioral suppression.  

Correlations like these can be difficult to find (and believe).  First, both the ERP and behavioral measures can be noisy, which attenuates the strength of the correlation and reduces power.  Second, spurious correlations are easy to find when there are a lot of possible variables to correlate and relatively small Ns.  A typical ERP session is about 3 hours, so it's difficult to have the kinds of Ns that one might like in a correlational study.  To address these problems, we conducted two experiments.  The first was not well powered to detect a correlation (in part because we had no idea how large the correlation would be, making it difficult to assess the power). We did find a correlation, but we were skeptical because of the small N.  We then used the results of the first experiment to design a second experiment that was optimized and powered to detect the correlation, using an a priori analysis approach developed from the first experiment.  This gave us much more confidence that the correlation was real.

Gaspelin-Pd-Exp3.jpg

We also included a third experiment that was suggested by the alway-thoughtful John McDonald. As you can see from the image above, the Pd component was quite early in Experiments 1 and 2. Some authors have argued that an early contralateral positivity of this nature is not actually the suppression-related Pd component but instead reflects an automatic salience detection process.  To address this possibility, we simply made the salient singleton the target.  If the early positivity reflects an automatic salience detection process, then it should be present whether the singleton is a distractor or a target.  However, if it reflects a task-dependent suppression mechanism, then it should be eliminated when subjects are trying to focus attention onto the singleton. We found that most of this early positivity was eliminated when the singleton was the target. The very earliest part (before 150 ms) was still present when the singleton was the target, but most of the effect was present only when the singleton was a to-be-ignored distractor. In other words, the positivity was not driven by salience per se, but occurred primarily when the task required suppressing the singleton.  This demonstrates very clearly that the suppression-related Pd component can appear as early as 150 ms when elicited by a highly salient (but irrelevant) singleton.

Electrophysiological Evidence for Spatial Hyperfocusing in Schizophrenia

Kreither, J., Lopez-Calderon, J., Leonard, C. J., Robinson, B. M., Ruffle, A., Hahn, B., Gold, J. M., & Luck, S. J. (2017). Electrophysiological Evidence for Spatial Hyperfocusing in SchizophreniaThe Journal of Neuroscience, 37, 3813-3823.

Double Oddball P3 Bar Graph.jpg

This paper from last spring describes new evidence for our hyperfocusing theory of cognitive dysfunction in schizophrenia.  Remarkably, we found that people with schizophrenia were actually better able to focus centrally and filter peripheral distractors than were control subjects. Under the right conditions, we even observed a (slightly) larger P3 wave in patients than in controls.
 

Decoding the contents of working memory from scalp EEG/ERP signals

Bae, G. Y., & Luck, S. J. (2018). Dissociable Decoding of Working Memory and Spatial Attention from EEG Oscillations and Sustained Potentials. The Journal of Neuroscience, 38, 409-422. [PDF]

In this recent paper, we show that it is possible to decode the exact orientation of a stimulus as it is being held in working memory from sustained (CDA-like) ERPs.  A key finding is that we could decode both the orientation and the location of the attended stimulus with these sustained ERPs, whereas alpha-band EEG signals contained information only about the location.  

Our decoding accuracy is only about 50% above the chance level, but it's still pretty amazing that such precise information can be decoded from brain activity that we're recording from electrodes on the scalp!

Stay tuned for more cool EEG/ERP decoding results — we will be submitting a couple more studies in the near future.